 KI
China on the path to 2040
How far society, labour and the state have advanced in transition, calculated per capita.
China enters the economy that is coming as a manufacturing superpower and a rising AI power. On this page you can see where it stands on the way to 2040, measured with the same indicators as the other three countries, and how its 14 pillars are faring.
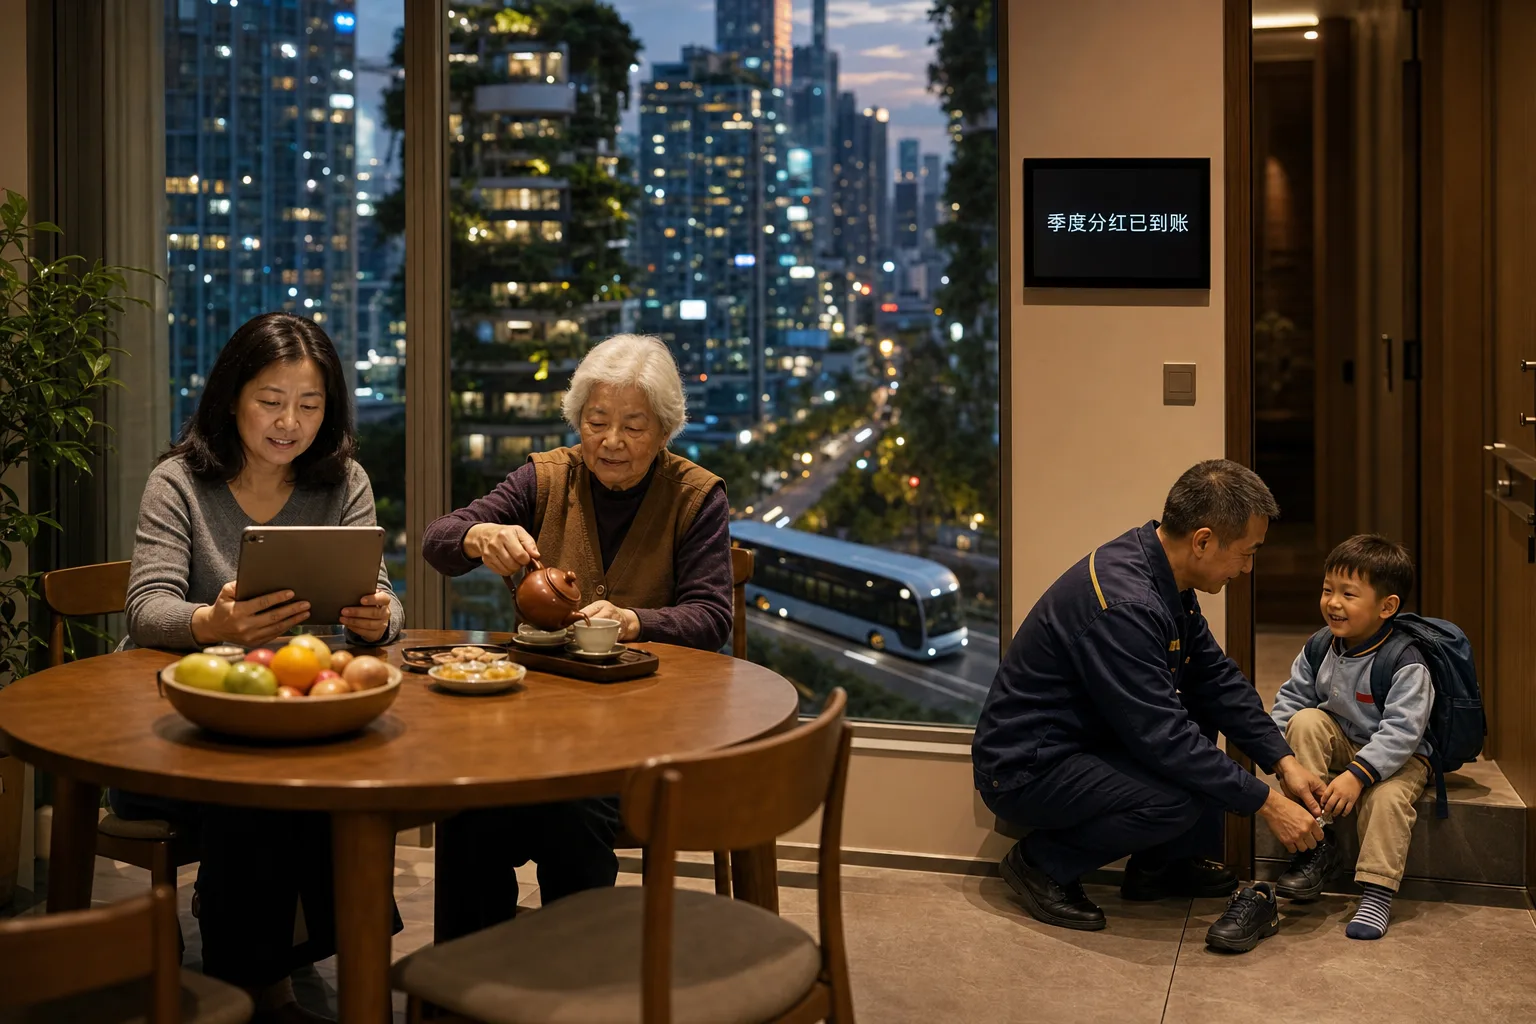
It is May 2040. A family in Shenzhen lives in an economy that has little in common with the one of 2026. Paid employment is one of several forms of contribution. The framework, however, is set by the state more firmly than elsewhere. Value creation, capital, and data flow largely through state-directed funds, platforms, and registries. AI-generated value does not belong only to the hyperscalers in California. China has its own foundation models, its own data centres, and a state that participates in the returns as the central actor in capital and data. The Wang family shows what that feels like.
A day with the Wang family
Wang Mei, 49, wakes up in a flat on the 28th floor of a high-rise in the Nanshan district of Shenzhen. For twelve years she led a customer-service team at a large trading platform. In the late 2020s, AI assistants handled most enquiries and the team shrank from sixty staff to ten. Through a retraining fund run by Guangdong province, she moved into quality control for those very systems.
Today Wang Mei handles the cases where the assistants fail: complaints with legal consequences, disgruntled major clients, and suspected fraud. She works five days a week, often longer than her contract specifies. She shares the care of her mother with a state-supported care platform, because the ageing population has sharply increased demand for care within just a few years.
Her husband Wang Jun, 52, drove buses for twenty years. As early as 2017, Shenzhen became the first city in the world to electrify its entire bus fleet, over 16,000 vehicles. Through the 2030s, buses ran without drivers on an ever-growing number of routes. Wang Jun now sits in a control centre overseeing a route with forty driverless buses. His shift is shorter than his time at the wheel once was. The time gained belongs to his grandson.
A notification appears on Wang Mei's mobile device: the quarterly credit from the state equity fund has arrived. Unlike in Germany, the dividend does not flow as an equal citizen dividend to all; it is tied to contribution record and residential status under the hukou system. The Wang family received Shenzhen's urban hukou years ago, but many migrant workers in the same building have not.
Their only son, Wang Hao, 29, is an engineer at a drone manufacturer in Shenzhen. He and his wife work long hours, as is customary in the sector. Access to housing, credit and services for the young family runs through a digital register that links payment, registration and behavioural data.
The grandson Xiaoyu, four, is raised mainly by the grandparents, as in many Chinese families. Wang Jun collects him after the early shift from the neighbourhood kindergarten. Since 2025, the state has paid 3,600 yuan per year for every child under three to support the low birth rate. The money flowed for Xiaoyu until his third birthday. After that, care falls to the family.
In the evening, Wang Mei attends a hearing of her residential committee on the construction of a new data centre. The decision rests with the administration, not with a vote. The hearing gathers feedback that feeds into the planning process. Participation is real, but guided: consultative, not directly democratic.
That is what a Wednesday looks like in 2040. That it appears smooth is the point: the system delivers speed and scale. How it does so, and at what cost to openness, is the architecture we describe in the Globalance Outlook.
How this world works
China's public revenues long rested on indirect taxes, production levies, and proceeds from state ownership of land. When the property market slumped in the late 2020s, that pillar fell away. In its place came a gradual broadening of consumption and wealth taxes, together with levies on the commercial use of data and computing power, collected through state-operated data markets.
Income security is no longer tied solely to paid employment, but it depends more on status than on citizenship. A basic safety net covers housing, health, and education, supplemented by distributions from state equity funds and by a Job Guarantee in care and infrastructure roles. Access depends on hukou status. The transition is under way but not yet complete.
The state is the principal owner of capital. Sovereign wealth funds, state-linked banks and state guidance funds hold large stakes in technology, energy and semiconductor companies. Private wealth formation has grown, but remains concentrated and heavily tied to property. Cooperatives of the Western model play almost no part. State-directed capital has taken their place.
China is a global manufacturing and robotics power. According to the IFR, it operates more than two million industrial robots. Paid employment remains central, yet care work is gaining recognition and partial remuneration as the population ages. The demanding 996 work ethic sits alongside a younger counter-movement known as tang ping, or lying flat.
China trains the world's largest cohorts of STEM graduates and engineers. Retraining and lifelong learning are organised by the state. At the same time, high youth unemployment weighed on the late 2020s. The labour market had to learn to absorb the large number of graduates entering it.
The political system has remained centrally directed. Participation exists through hearings, petition platforms and residential committees, but it is consultative rather than decisive. AI steers and plans; it does not widen political competition.
Data are a state-administered factor of production. Since the Personal Information Protection Law (PIPL) of 2021 and the establishment of state-run data exchanges, data are traded and taxed, whilst remaining subject to comprehensive state access. According to the Stanford AI Index 2026, China accounted for the largest share of global AI patents and has nearly closed the performance gap with leading models.
The pension system is fragmented and divided between urban and rural areas. As the population aged, the statutory retirement age rose gradually from 2025. Care work has become part of a Job Guarantee, because demand is rising steeply. By 2040, a quarter of the population will be approaching retirement age.
The state supports births with cash; families, often the grandparents, continue to carry the care. The 2025 child allowance was the beginning. Nursery provision has been expanded but remains scarce in the cities.
China is simultaneously the world's largest emitter and its largest builder of renewable energy capacity. The massive rollout of solar, wind and grid infrastructure has partly absorbed the energy appetite of data centres. Coal remains a bridge fuel, however. Growth and emissions have decoupled only slowly.
Questions of meaning arise here too. The performance pressure of 996 culture, high housing costs and intense competition have fed the tang ping movement. The state responds with promises of stability and common prosperity. The balance between control and individual purpose remains unresolved.
What set the system in motion
This world did not emerge from a single decision. It is the result of a chain of triggers between 2027 and 2036.
A wave of automation swept through manufacturing and office work. Robot density and AI systems eliminated millions of routine jobs, while youth unemployment stayed high. The state launched large-scale retraining funds.
The population continued to shrink after peaking at around 1.41 billion, whilst the share of those aged over 65 rose to approximately one quarter. The funding gap in the fragmented pension systems became impossible to ignore.
The collapse of the property market and the debt burden carried by local governments undermined the foundations of the old growth model. The state redirected its economic base and revenue streams towards technology, data, and equity funds.
Export controls on advanced semiconductors and manufacturing equipment forced China to pursue a policy of compute sovereignty: its own chips, its own models, its own data centres, whatever the cost.
The performance pressures of the 996 culture and the tang-ping movement forced the state to underpin its shared-prosperity pledge with tangible social protection.
What is robust about this story
We are not saying: this is exactly what will happen. We are saying: it could happen, if the right decisions are taken in time.
Three questions remain open: the pace (2040 is an assumption, not a promise), semiconductor sovereignty (the outcome of export controls is uncertain), and the social balance between state direction and individual freedom. It also remains to be seen whether grandparents can continue to bear this burden as the retirement age keeps rising.
China's pillars
Whether China shapes the transformation or is shaped by it will be decided through its pillars. They range from public finance through education and labour to social cohesion. Each pillar shows where the country stands, where it is under strain, and which junctures lie ahead. The badge at the top right shows the status of that pillar in China:
On track: The pillar is moving in the right direction. Building up: The first building blocks are in place, but the pace must increase. Open turning point: The directional decision has yet to be made. Critical turning point: This is where the scenario will be decided.
How far along is China?
In absolute figures, China is among the world leaders: no country publishes more AI research, nowhere are more industrial robots installed, and only the USA is ahead in computing power. Readiness 2040 measures per capita, however, and spread across 1.4 billion people China falls far back. One hour of work generates around 21 purchasing-power-adjusted dollars, roughly a quarter of the level in Europe and the USA, and employees work nearly 45 hours a week. The transition has begun — visible, for example, in higher education, where China has caught up with industrialised countries. It has not yet reached the economy as a whole.


In absolute terms, China is a clear number two behind the United States, and leads on research and patents. It ranks lower on 2040 readiness because that measure is calculated per capita.
Sources: Epoch AI, Stanford AI Index 2026, Borderstep/Bitkom, OpenAlex · As of 10 October 2026 · not included in the Readiness 2040 score · See full technology view →
How it is calculated
Each indicator receives 0 to 100 points. 0 is the starting level, 100 the 2040 vision, the same for all four countries. Within a group the points are averaged; Readiness 2040 is the average of the four groups. In the infrastructure group, low-carbon electricity and computing power count for half each. Distribution is shown but does not count.
The ten indicators
For context: distribution
We show how income and wealth are distributed for each country. This does not feed into Readiness 2040, because these figures mainly reflect a country's economic structure rather than how far its transition has progressed.
The global index measures alongside this how far the world economy as a whole has progressed on this path. Readiness 2040 is a distinct measurement with its own scale; the two figures cannot be compared directly.
14 measures, four countries
The lead source for each topic, China highlighted. «–» means: no comparable measurement.
Microsoft AI Diffusion Report 2025 H2 · second half of 2025
Stanford AI Index 2026 · 2024
OECD Employment Outlook 2023 · 2019
OECD PIAAC 2023 (Trends in Adult Learning 2025) · 2023 (Erhebung 2022/23)
ILOSTAT (ILO) · 2022–2025
UBS Global Wealth Report 2026 · 2025
Show all 14 topics
OECD Pension Markets in Focus 2025 · 2024
Penn World Table 11.0 · 2023
IWF WEO April 2026 · 2025
Stanford AI Index 2026 / LinkedIn · 2025
Ipsos AI Monitor 2026 · 2026
OECD PIAAC 2023 · 2023
WVS/EVS Welle 7 (Erhebungen 2017–2018) · 2017–2022
WVS/EVS Welle 7 (Erhebungen 2017–2018) · 2017–2022
All values with primary sources: Country comparison as Excel
The seven areas: where China gains and where it comes under pressure
The seven areas of transformation through a Chinese lens. Select a topic on the left; the detailed metrics and cross-country comparisons will appear on the right.
Technology & AI
China is an AI superpower: leading in patents and publication volume, with model quality catching up rapidly and its own data centres, while remaining dependent on advanced chip hardware.
According to the Stanford AI Index 2026, Chinese actors account for approximately 70 per cent of global AI patents and more than 23 per cent of publications; the performance gap between China's leading models and US frontier models had narrowed to a few percentage points by 2026. China released around 30 notable AI models in 2025 (US: 50), but doubled its tally year on year. Private AI investment is officially far smaller than in the United States ($12.4bn versus $285.9bn), though this figure is likely understated given the role of state-directed funds. Sovereignty over advanced semiconductors remains the most exposed vulnerability.
 China95USA85Germany66
What is measured: share of AI patents filed worldwide; China leads by a wide margin, at approximately 70 per cent.
Source: Stanford AI Index / WIPO
China85USA100Germany45What is measured: the number and quality of notable foundation models per year (the USA leads; China is catching up quickly).
Source: Stanford AI Index
China70USA100Germany30What is measured: capital invested in AI; officially lower than the United States, likely understated via government guidance funds.
Source: Stanford AI Index
Assessments relative (0–100), compiled by the Globalance Research Team.
Economics & Capital
China remains the industrial core of the global economy, with deep manufacturing capabilities and strong R&D growth, but is weighed down by its property crisis, local government debt, and lower hourly productivity.
About 38% of value added comes from industry and construction (NBS China / World Bank). R&D spending stands at roughly 2.6% of GDP. Output per hour worked remains well below Western levels, however. China has yet to cross the middle-income threshold. The collapse of the property market in the late 2020s and the debt burden of local governments undermined the old growth model. Value creation is shifting towards technology, data and state investment funds.
China92USA48Germany88What is measured: share of industry and construction in gross value added; China leads by a significant margin.
Source: NBS China / World Bank
China45USA92Germany80What is measured: output per hour worked; China remains below Western levels.
Source: OECD / World Bank
Assessments relative (0–100), compiled by the Globalance Research Team.
Labour & Automation
China combines the world's highest rate of robotisation with a shrinking labour force and periodically elevated youth unemployment — automation is hitting manufacturing and office work simultaneously.
According to the IFR, China operates more than two million industrial robots and has already surpassed Germany and Japan in robot density. Automation is raising productivity, but is simultaneously affecting routine work in both manufacturing and office environments, while demographic contraction further intensifies the pressure to automate. At the same time, the labour market has had to absorb a large number of university graduates; youth unemployment weighed heavily on the late 2020s. Whether AI will support the narrow labour force or generate disruption will be determined by the pace of state-organised retraining.
China90USA55Germany82What is measured: industrial robots per 10,000 employees; China has overtaken Germany and Japan.
Source: IFR
China62USA62Germany66What is measured: share of workers with high automation potential (higher = greater pressure).
Assessments relative (0–100), compiled by the Globalance Research Team.
Monetary Policy & Finance
China holds deep foreign exchange reserves and considerable state steering capacity, yet is weighed down by the property crisis, high local-government debt and limited household participation in capital markets.
The high savings rate and state-controlled banks give the government significant steering capacity, yet the collapse of the property market and local-government indebtedness are straining financial stability. A large share of household wealth is tied up in real estate; broad participation in equity and capital markets remains limited, and the stock market is volatile. In an economy where returns on capital outpace labour income, this structure exacerbates the wealth divide, while weak domestic consumption acts as a drag on growth.
China45USA30Germany62What is measured: total debt including local government; lower = greater fiscal headroom (China burdened by local government debt).
Source: IMF / NBS China
China40USA85Germany38What is measured: share of households holding equities or funds; wealth heavily concentrated in property.
Source: PBoC / CSRC
China45USA75Germany74What is measured: financial system stability; burdened by the property crisis and local government debt.
Source: IMF / PBoC
Assessments relative (0–100), compiled by the Globalance Research Team.
Geopolitics & Governance
China is a global powerhouse in exports and computing capacity, with leading data centre infrastructure, yet remains import-dependent for advanced semiconductors and manufacturing equipment and is subject to export controls.
As the world's largest merchandise exporter, China wields considerable trade power, and the expansion of domestic data centres is advancing its computing sovereignty. The most exposed vulnerability remains its dependence on advanced chips and manufacturing equipment — including EUV lithography — which Western export controls are specifically targeting. The state is responding with an assertive self-sufficiency drive encompassing domestic chips, home-grown models and proprietary standards; the success of this effort will determine China's technological sovereignty through to 2040.
China45USA78Germany46What is measured: domestic manufacturing and supply security for advanced semiconductors.
Source: IMF / industry reports
China80USA95Germany46What is measured: computing power available domestically for AI; China is building out capacity faster than any other country.
Source: Stanford AI Index
Assessments relative (0–100), compiled by the Globalance Research Team.
Society & Psychology
Surveys show high institutional trust and strong openness to AI in China, yet the country faces rapid ageing, intense performance pressure (996 culture) and a growing withdrawal movement (tang ping).
Surveys such as the Edelman Trust Barometer record high levels of measured trust in state institutions in China, and the population is more open to AI than many Western societies. At the same time, ageing, high housing costs and the performance pressures of 996 culture are generating tensions; the tang ping, or 'lying flat', movement is raising fundamental questions about the meaning of work. The state responds with a promise of stability and common prosperity — the balance between control and individual purpose remains unresolved.
China85USA40Germany50What is measured: Trust in state institutions as captured by surveys.
Source: Edelman
China82USA66Germany46What is measured: public acceptance of AI use in everyday life and the workplace.
Source: Ipsos / Stanford AI Index
Assessments relative (0–100), compiled by the Globalance Research Team.
Investment Implications
In China, the new capital stock is predominantly state-owned; households hold wealth primarily in real estate, and broad household participation in the AI economy remains limited.
Unlike funded systems, value creation flows primarily through sovereign wealth funds, state-affiliated banks, and flagship funds. Funded pension assets per capita are low, and the pay-as-you-go retirement system is fragmented. A large share of household wealth is tied up in property — following its sharp decline, a concentrated risk for broad sections of the population. In an economy where returns on capital outstrip labour income, this creates a structural disadvantage for private wealth accumulation as long as state-directed capital remains dominant.
China25USA78Germany42What is measured: Funded pension assets per capita (low in China; pay-as-you-go system fragmented).
China35USA85Germany38What is measured: the prevalence of equity and fund ownership among the population.
Source: CSRC / PBoC
China55USA65Germany42What is measured: Share of forward-looking, productive investment (heavily state-directed in China).
Source: Globalance perspective
Assessments relative (0–100), compiled by the Globalance Research Team.
What to do in China
Concrete steps on three levels, ordered by who decides: you as an investor, companies and institutions, and policymakers.