 KI
Switzerland Towards 2040
How far society, labour and the state have advanced in transition, calculated per capita.
Small country, open economy, direct democracy: Switzerland is best placed to shape the transformation, provided it sets its course in time. On this page you can see where it stands on the way to 2040, measured with the same indicators as the other three countries, and how its 14 pillars are faring.
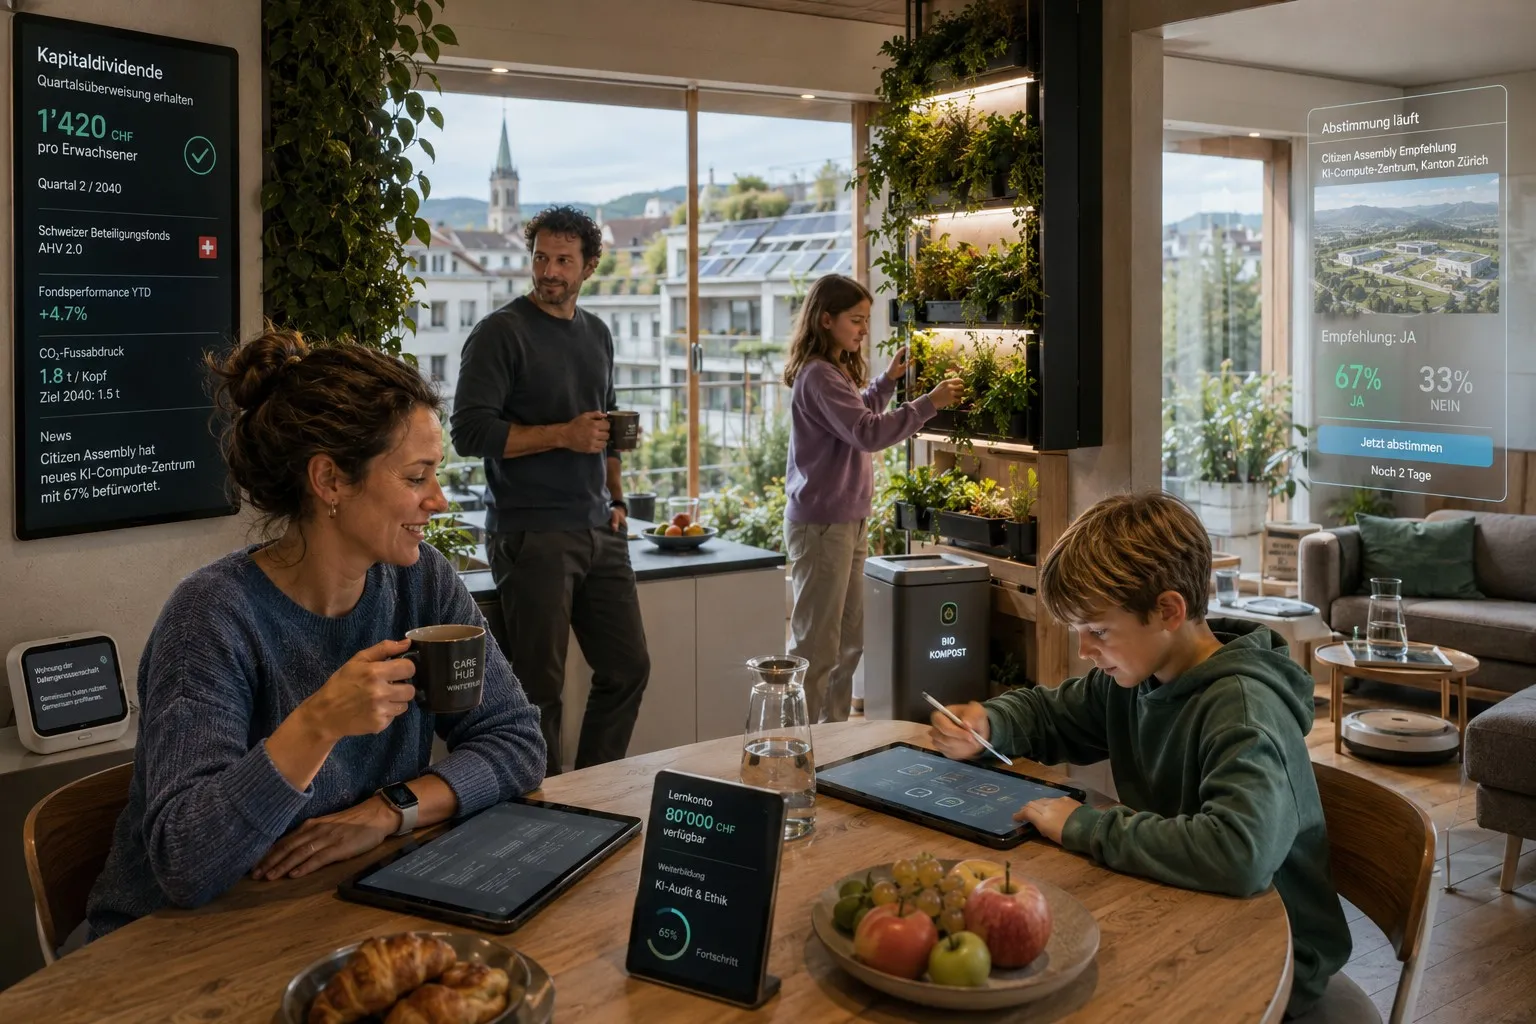
It is May 2040. A Swiss family from Winterthur lives in an economy that has little in common with that of 2026. Paid work is an option, not an obligation. The welfare state is no longer funded by wages but by capital, data and externalities. The value created by AI no longer belongs only to hyperscalers in California. Switzerland holds substantial stakes through a sovereign fund that pays every citizen an annual Capital Dividend.
A day in the life of the Tanner family
Lara Tanner, 40, wakes up in a cooperative flat in a district that was still a run-down industrial area in 2030. The flat belongs to a data cooperative that arranges affordable housing for its members. It is financed from the returns the same cooperative network earns with jointly managed health data. Lara pays 720 francs a month for 78 square metres; the market price would be about twice that.
She works three days a week at a care hub for older people. In 2026 this kind of work counted as unpaid women's labour; today, under the expanded Job Guarantee, it pays CHF 38 an hour. Two days a week she works on something of her own: a small education platform for career reinvention that she built with three others through a platform cooperative. The platform is small, but it is growing. And it belongs to her. Not to a VC, not to a corporation.
Her husband Andreas, 42, was a software developer. He no longer is. Since around 2034, the tasks he still did in 2026 have been handled by an AI system at the bank where he worked. He completed the re-skilling programme of the unemployment insurance and now works as an AI auditor. He checks whether the models that make economically relevant decisions are fair, explainable and compliant. He works four days a week, 32 hours, for the same pay. In 2036 the bank passed on part of its productivity gains as time. Wednesday belongs to the children and the community: Andreas sits on the school board, an honorary office, and coaches Leo's floorball team in the afternoon. The step was not easy. The first months without a full week felt like half a dismissal. When someone asks him today what he does for a living, he says: “I check machines. And I am on the school board.”
Mia is twelve, Leo ten. Both attend the all-day school in their neighbourhood, from eight to half past three, lunch included. Since the all-day school became part of basic provision in 2033, it costs parents nothing. Only the nursery years before that were expensive. When Mia was small, a day at a nursery in the city of Zurich cost between 150 and 180 francs (source: kihz). The new federal childcare allowance covered only a small part of that. Lara worked out every month whether her third working day was worth it. Today the Tanners pay nothing for childcare. The income-independent flat-rate contribution is paid only by parents whose children attend a nursery.
A notification appears on Lara's mobile: the Swiss Capital Dividend for the quarter has been transferred, 1,420 francs per adult. For Mia and Leo, a quarter of that each flows into their learning account, available from age 18. The money comes from the returns of the "Swiss Participation Fund", introduced in 2034 as AHV 2.0 and today holding CHF 480bn in stakes in domestic and global technology, energy and infrastructure companies.
In the evening Lara votes on a new AI computing centre in the canton of Zurich. The vote is conducted through a Citizens' Assembly in which randomly selected citizens deliberated with experts over six months. The result is clear: 67% in favour. Politics has not become less democratic; it has become better informed.
This is what a Wednesday in 2040 looks like. What seems unremarkable here is the point: it works. We describe how it works as the Globalance Outlook.
How this world works
By 2040 labour income tax accounts for only 32% of Swiss government revenue, compared with over 50% in 2026. Three pillars have compensated for the shortfall: higher capital gains taxation at the OECD minimum rate of 22%, a substantial CO₂ tax of around EUR 220 per tonne, and an explicit data levy on AI training data. Switzerland introduced these measures gradually, with initial reforms in 2027 and full implementation by 2034.
Economic security is no longer tied to paid employment. Three pillars: Universal Basic Services (housing, healthcare, education, mobility, internet) as the foundation; a Capital Dividend of CHF 1,420 per quarter drawn from the Swiss Participation Fund; and a Job Guarantee in care, caring, and climate sectors as an optional supplement. Universal Basic Income (UBI) as the maximum variant never materialised.
The Swiss Participation Fund (established in 2034 as an extension of the AHV) today holds CHF 480 billion in equities, infrastructure, and AI stakes. In addition, more than 200 data cooperatives exist with a combined membership of 4.2 million. Platform cooperatives lead the market in three sectors: care, local logistics, and reskilling.
Paid employment is one of several legitimate forms of contribution. Care work, community commons activity, and artistic and scientific work have counted as recognised activities since 2032. They qualify for AHV contributions and social recognition. The category of full unemployment no longer exists. Standard full-time hours in 2040 are 32 to 34 per week. Many companies have passed productivity gains on as time.
The learning-account model has overhauled the education system. Every citizen holds a lifelong account worth CHF 80,000. Re-skilling at 45 or 55 is standard practice.
Direct democracy was not replaced but extended. Citizens' Assemblies prepare complex proposals. Final votes remain with the electorate. AI supports deliberation, not decision-making. That is what the Algorithmic Accountability Act has required since 2031.
Since 2033, foundation models in public administration and research have been organised within a European AI Commons. Private models continue to operate, constrained by data-sharing obligations and strategic equity stakes.
In 2034 the AHV became "AHV 2.0": a pay-as-you-go system combined with a capital stock. Care is part of the Job Guarantee and paid accordingly. The care shortage of the late 2020s is history.
In 2040, childcare is treated as infrastructure, like roads and schools. All-day schools have been part of basic provision since 2033, and nurseries charge an income-independent flat-rate contribution. Parliament took the first step at the end of 2025: a childcare allowance of at least 100 francs per month per care day for children up to the age of eight. At the time, the cost of nursery care often determined whether the second parent worked. In 2040 it no longer does.
The CO₂ tax has worked. Swiss per-capita emissions fell from 4.4 tonnes in 2026 to 1.8 tonnes in 2040. Growth has been decoupled from resources by changing how value is created, not through austerity.
The "crisis of meaning of the early 2030s" was overcome through meaningful forms of contribution, expanded psychological care provision and new communities. The old question "What do you do for a living?" is now "What are you working on at the moment?"
What set the system in motion
This world did not emerge from a single decision. It is the result of a chain of triggers between 2027 and 2034.
A wave of layoffs hit the knowledge economy. Between 2027 and 2030, banks, insurers and consultancies cut around 65,000 positions in Switzerland, all in roles that AI models were able to take over. The first pilot laws for expanded capital gains taxation came in 2028, in Switzerland and Sweden in parallel.
An OECD study in 2029 set out the arithmetic. On the prevailing trajectory, around 35% of the Western labour income tax base would erode by 2040. Finance ministers began to restructure their tax systems pragmatically, not ideologically.
The Swiss initiative «Participation Fund Model» is adopted in 2032 with a 58% yes vote, carried by an unusual alliance of Social Democrats, the Centre and parts of the business community. It won because it was not UBI.
The EU AI Sovereign Fund (2031) and the EU data levy (2032) created the framework within which Switzerland was able to embed its own mechanisms without competitive disadvantage.
The "crisis of meaning of the early 2030s" damaged the old promise that paid work is the primary source of meaning in life. The discourse opened up to other forms of contribution.
What is robust about this story
We are not saying: this is exactly what will happen. We are saying: it could happen, if the right decisions are taken in time.
Three aspects remain open: the pace (2040 is an assumption, not a promise), the global dimension (the United States and China are developing differently), and the question of purpose (overcoming the crisis of meaning is an optimistic assumption). It also remains to be seen where time freed up in this way will go: to family and community, or to a screen.
The pillars of Switzerland
Whether Switzerland shapes the transformation or is swept along by it will be determined by the strength of its pillars. These span public finance, education, labour, and social cohesion. Each pillar shows where the country stands, where it is under strain, and which decisions lie ahead. The badge at the top right shows the current state of each pillar in Switzerland:
On track: The pillar is moving in the right direction. Building up: The first building blocks are in place, but the pace must increase. Open turning point: The directional decision has not yet been taken. Critical turning point: This is where the scenario will be decided.
How far has Switzerland come?
Switzerland leads because it ranks first in three of the four groups and second in the fourth. Per inhabitant, it produces more AI publications than any of the three other countries, each working hour generates the highest output, and electricity comes almost entirely from low-carbon sources. Switzerland trails in industrial automation: with 294 robots per 10,000 employees, it falls short of both Germany and the USA. Those in employment also work significantly longer hours, at 34.6 per week, than their counterparts in Germany.


In absolute terms, Switzerland is a very small AI hub. Per capita, its research is strong. That is why it leads in Readiness 2040.
Sources: Epoch AI, Stanford AI Index 2026, Borderstep/Bitkom, OpenAlex · As of 10 October 2026 · not included in the Readiness 2040 score · See full technology view →
How it is calculated
Each indicator receives 0 to 100 points. 0 is the starting level, 100 the 2040 vision, the same for all four countries. Within a group the points are averaged; Readiness 2040 is the average of the four groups. In the infrastructure group, low-carbon electricity and computing power count for half each. Distribution is shown but does not count.
The ten indicators
For context: distribution
We show how income and wealth are distributed for each country. This does not feed into Readiness 2040, because these figures mainly reflect a country's economic structure rather than how far its transition has progressed.
The global index measures alongside this how far the world economy as a whole has progressed on this path. Readiness 2040 is a distinct measurement with its own scale; the two figures cannot be compared directly.
14 measures, four countries
The lead source for each topic, Switzerland highlighted. «–» means: no comparable measurement.
Microsoft AI Diffusion Report 2025 H2 · second half of 2025
Stanford AI Index 2026 · 2024
OECD Employment Outlook 2023 · 2019
OECD PIAAC 2023 (Trends in Adult Learning 2025) · 2023 (Erhebung 2022/23)
ILOSTAT (ILO) · 2022–2025
UBS Global Wealth Report 2026 · 2025
Show all 14 topics
OECD Pension Markets in Focus 2025 · 2024
Penn World Table 11.0 · 2023
IWF WEO April 2026 · 2025
Stanford AI Index 2026 / LinkedIn · 2025
Ipsos AI Monitor 2026 · 2026
OECD PIAAC 2023 · 2023
WVS/EVS Welle 7 (Erhebungen 2017–2018) · 2017–2022
WVS/EVS Welle 7 (Erhebungen 2017–2018) · 2017–2022
All values with primary sources: Country comparison as Excel
The seven areas: where Switzerland gains and where it faces pressure
The seven areas of transformation through a Swiss lens. Select an area on the left: detailed metrics with country comparisons appear on the right.
Technology & AI
ETH/EPFL, pharma AI, and a dense deep-tech ecosystem: world-class research. The question is whether value creation stays in the country.
Switzerland publishes more top-tier AI research per capita than any EU country and ranks among the leaders in AI patents per head. The open flank is scale: the capital and computing power needed for commercialisation sit in the United States. The research lead will translate into value creation only if venture capital and infrastructure grow alongside it domestically.
 Switzerland95Germany45USA75
What is measured: share of publications at leading AI conferences and journals per 1m inhabitants (Stanford AI Index).
Source: Stanford AI Index
Switzerland90Germany55USA80What is measured: AI patent applications per 1m inhabitants (WIPO/IGE).
Switzerland45Germany25USA100What is measured: venture capital invested in AI start-ups per inhabitant per year.
Source: SECA / Startup Radar
Assessments relative (0–100), compiled by the Globalance Research Team.
Economics & Capital
Pharma, precision industries and the financial centre: capital-intensive, knowledge-based sectors are early beneficiaries of AI-driven productivity.
Switzerland's export economy is knowledge-intensive and high-margin. That is precisely the structure in which AI productivity translates into profits first. The vulnerable part is the industrial base, which faces price competition from Asian manufacturers deploying robotics.
Switzerland90Germany70USA85What is measured: economy-wide labour productivity (OECD).
Source: OECD
Switzerland85Germany70USA75What is measured: share of employment in knowledge-intensive services and high-tech industry.
Assessments relative (0–100), compiled by the Globalance Research Team.
Labour & Automation
The large share of back-office and administrative roles represents the greatest vulnerability in the Swiss labour market.
The AI wave hits clerical work, administration and financial back-office functions first. These are areas with a high share of Swiss employment. The counterforce is that skills shortages in healthcare, construction and engineering absorb part of the shift.
Switzerland55Germany65USA62What is measured: share of workers in occupations with high automation potential (OECD methodology).
Switzerland50Germany45USA40What is measured: share of employed persons undergoing significant vocational retraining per year.
Switzerland75Germany70USA60What is measured: skilled-labour shortage indicator: unfilled positions in healthcare and technology.
Source: Adecco Job Index / x28
Assessments relative (0–100), compiled by the Globalance Research Team.
Monetary Policy & Finance
A strong franc, an independent SNB and low debt levels: more room than almost any other country to finance the transition.
Low public debt and a credible central bank give Switzerland options that heavily indebted countries do not have: from investment programmes to cushioning transition costs.
Switzerland90Germany60USA35What is measured: gross government debt as a percentage of GDP (lower = greater fiscal headroom; bar shows headroom).
Switzerland80Germany60USA50What is measured: the gap between financing costs and the rate of economic growth.
Assessments relative (0–100), compiled by the Globalance Research Team.
Geopolitics & Governance
Caught between EU regulation, US platforms and Asian hardware: digital sovereignty must be actively negotiated.
Switzerland sits between blocs: the EU pulls on regulation, the US dominates technology, and Asia leads in hardware. The Swiss path, independent yet connected, must be built actively through the 2020s.
Switzerland40Germany45USA90What is measured: share of critical public workloads with a sovereign operating option.
Source: Federal Council
Switzerland45Germany40USA60What is measured: concentration of chip and hardware supply chains (higher score = more diversified).
Source: Foreign trade statistics
Switzerland65Germany90USA70What is measured: compatibility of the domestic legal framework with EU and US regulatory regimes.
Source: Federal Council / OECD
Assessments relative (0–100), compiled by the Globalance Research Team.
Society & Psychology
High social cohesion and the militia system help cushion identity losses as paid employment declines in importance.
The militia system, club culture and voluntary work give Switzerland structures of contribution and purpose beyond the job. That is an underestimated locational advantage for the transition into the economy ahead.
Switzerland85Germany55USA40What is measured: public trust in government, public administration, and media (survey-based).
Switzerland80Germany65USA70What is measured: share of the population engaged in regular unpaid contributory work.
Source: BFS
Assessments relative (0–100), compiled by the Globalance Research Team.
Investment Implications
Pension assets of over CHF 1,000bn: no country is better placed to give its population a stake in tomorrow's capital.
Pension funds and Pillar 3a are the country's largest ownership vehicle. Whether they participate in the AI capital stock depends on investment strategies. Here the country scenario connects directly to the investment-strategy level of the platform.
Switzerland100Germany35USA75What is measured: funded retirement assets (BVG + pillar 3a) per capita.
Source: BVG statistics / OAK
Switzerland70Germany45USA85What is measured: share of households holding equities or funds, directly or via retirement savings.
Source: SNB
Assessments relative (0–100), compiled by the Globalance Research Team.
What to do in Switzerland
Concrete steps on three levels, ordered by who decides: you as an investor, companies and institutions, and policymakers.